

How can we help?
Search for answers or browse our knowledge base
Create a dynamic graph
General
The following named areas are managed (local or global)
- reference (absolute)
- value
- formula without relative reference (except matrix formulas)
We can use a name field in the graphs. The engine correctly manages the reference operator on the areas.
Dynamic Named Area
In Excel, create a chart. For example, a series per product on all sellers as below. If we add sellers from column G (i.e., after seller 5), the graph doesn’t take this addition of sellers into account. You will need to go over the data selection to add the column(s).
If the number of vendors is unknown and a column pack is set up, the display of the board won’t be a problem. But the graph will be able to display “empty” data points if the data range contains all the columns with a column conditioning formation. If the zone named Seller is a zone named dynamic, regardless of the number of columns, the graph will be updated systematically, thanks to the functions OFFSET and COUNTA as in the example below:
(Warning, if a named area is a formula, it becomes volatile. Thus, any calculation using this name area becomes volatile)
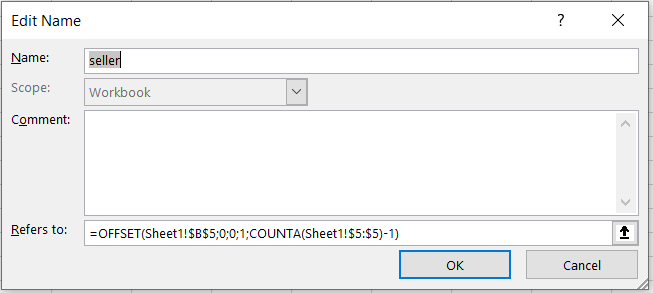
The formula =OFFSET($B$5;0;0;1;NBVAL($5:$5)-1) is explained as follows:
- COUNTA() : counts the number of non-empty cells. So COUNTA($5:$5)-1) allows to count the number of sellers online 5 by removing the total, thanks to the -1.
- OFFSET(Ref; Number of rows; Number of columns; Height; Width ) determines the range to be selected.
Note, however, that the name of the tab will be added to the function in the name manager, and that in the chart formula, the name of the workbook is added to the named area.
Applications
In which cases is it interesting to use the named areas in a graph?
- Wish to visualize on a graph only part of the data, for better exploitation or analysis.
- Simplified reading of data series.
- In a pattern, the number of lines isn’t known in advance. With a name area, the line of the initial pattern and the line just below it are taken into account to name a area, and when the data is customized or entered by the recipient, the graph is updated.